Generating WebAssembly CPU Profiles in Go

Go has had WebAssembly (wasm) support for a while now, but the tooling is still in it’s nascent stages. It is straightforward to build a wasm module from Go code, but running tests in a browser is still cumbersome, as it requires some HTML and JS glue to work, and generating a CPU profile isn’t even possible since wasm does not have thread support (yet).

I wrote a tool wasmbrowsertest which automates the running of tests in a browser and adds the ability to take a CPU profile. The idea is to compile the test into a binary and spin up a web server to serve the required HTML and JS to run the test. Then we use the Chrome Devtools Protocol to start a headless browser and load the web page. Finally, the console logs are captured and relayed to the command line.

This takes care of running the tests. But this post is about how to generate and analyze CPU profiles in WebAssembly natively, using the Go toolchain. Before I proceed, I should clarify that the following was done in a Chromium-based browser since it needs to work with the Chrome Devtools Protocol. The footnotes section explains why Selenium wasn’t used.

The problem

The developer tools in Google Chrome can take CPU Profiles of any webpage. This allows us to get a profile while the wasm test is running in the browser. But unfortunately, this profile has its own format, and the Go toolchain works with the pprof format. To make this work natively in Go, we need to convert the profile from this devtools format to the pprof format.

What is a profile

At a very basic level, a profile is just a set of samples, where each sample contains a stack frame. The difference in various profile formats lie in how all of it is represented on disk. Let us look into how this is represented in the devtools format, and then we will go over how to convert it to the pprof format.

CDP Profile

A CDP (Chrome Devtools Protocol) profile is represented in a json format with the following top-level keys:

{
	"startTime": ..., // Start time of the profile in us
	"endTime": ..., // End time of the profile in us.
	"nodes": [{...}, {...}, ...],
	"samples": [1,2,1,1],
	"timeDeltas": [...,...], // Time interval between consecutive samples in us.
}

nodes is a list of profile nodes. A node is a single function call site containing information about the function name, line number, and the script it was called from. It also has it’s own unique ID. And a list of child IDs, which are IDs of the respective child nodes.

samples represents the samples taken during a profile. It is a list of node IDs, where each ID points to the leaf node of a stack frame.

To represent it in a diagram:

cdp diagram

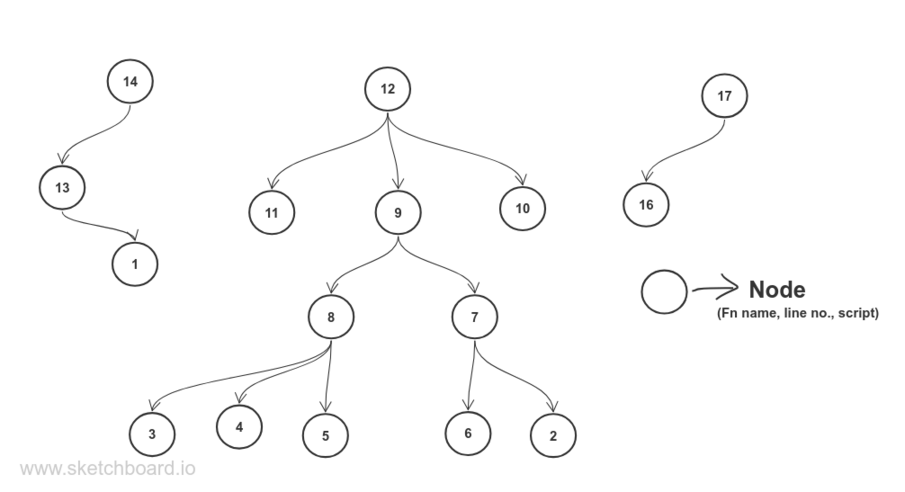
For node 12- 9,10 and 11 are its child IDs.

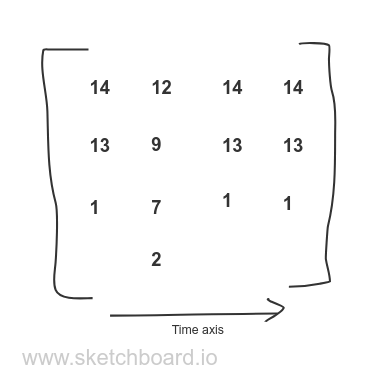
From our samples array above, we have 1,2,1,1 as samples. So, in terms of a list of stack frames, it becomes

stack frames

PProf Profile

A pprof profile is a proto file which is serialized and stored on disk in a gzip-compressed format. Now, a profile for code running natively on a machine will contain extra information regarding the memory address space locations and other stuff. But since our chrome profile runs inside a browser, we do not have access to such low-level details, and hence our converted profile will not have all the features of a proper pprof profile.

At a high level, a pprof profile has:

type Profile struct {
	Sample            []*Sample
	Location          []*Location
	Function          []*Function

	TimeNanos     int64
	DurationNanos int64
}

type Sample struct {
	Location []*Location
}

type Location struct {
	ID       uint64
	Line     []Line
}

type Line struct {
	Function *Function
	Line     int64
}

type Function struct {
	ID         uint64
	Name       string
	Filename   string
}

Essentially, a profile contains a list of samples. And each sample contains a list of locations. Each location contains a function object along with it’s line number (for simplicity’s sake, we will consider each location to have a single line). Lastly, a function object just has the function name and the file name from where it was called.

pprof diagram

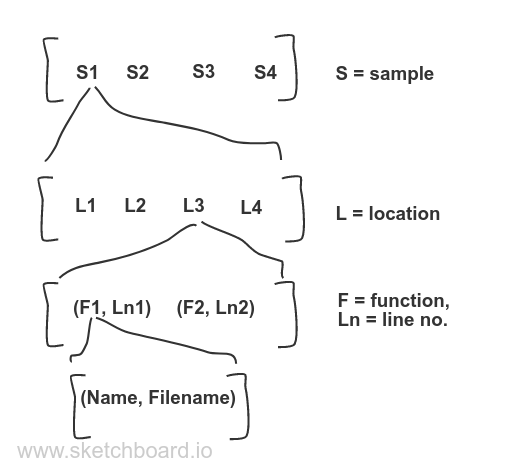
It is a flat representation where the hierarchy is maintained by pointers. So, to construct such a profile, we need to create it from the bottom up- i.e. first we need to construct the list of functions, then locations and then samples.

Converting Devtools to Pprof

To quickly recap what we are trying to achieve here: we have a devtools profile in a json format, and we want to convert it to a pprof format like the struct mentioned above. The TimeNanos and DurationNanos are simple and can be directly set. To create the Function and Location slices, we just need to iterate through the nodes array. As a quick reminder: a node is a single function call site containing information about the function name, line number, and the script it was called from, along with it’s own unique ID.

Note that the node ID is for the node and does not guarantee that different nodes will have different callframes. So we need to create a unique key that we can use to uniquely identify functions. Let that key be - FunctionName + strconv.Itoa(int(LineNumber)) + strconv.Itoa(int(ColumnNumber)) (we get these fields from the callframe object). And for every new instance of a Function, we will use a monotonically increasing uint64 as the function ID. For the location ID, we can directly use the node ID.

So with that, we can get the slice of Functions and since we have the line number too inside the callframe, we can create the Location slice also.

But before we construct the Sample information, we need to create the stack frame of each sample. That information is not directly present in the profile, but we can generate it.

We have the list of children of each node. From this, we can construct the inverse relation where we know what is the parent of each node. Let’s have a map from a nodeID to a struct, containing the pointer to a node and also its parent. Then we can iterate the samples list again and for each child of a node, we point the child to the current node. This will complete all the connections where each node points to its parent.

This is a simplified code snippet which shows what is being done.

// locMeta is a wrapper around profile.Location with an extra
// pointer towards its parent node.
type locMeta struct {
	loc    *profile.Location
	parent *profile.Location
}

// We need to map the nodeID to a struct pointing to the node
// and its parent.
locMap := make(map[int64]locMeta)
// A map to uniquely identify a Function.
fnMap := make(map[string]*profile.Function)
// A monotonically increasing function ID.
// We bump this everytime we see a new function.
var fnID uint64 = 1

for _, n := range prof.Nodes {
	cf := n.CallFrame
	fnKey := cf.FunctionName + strconv.Itoa(int(cf.LineNumber)) + strconv.Itoa(int(cf.ColumnNumber))
	pFn, exists := fnMap[fnKey]
	if !exists {
		// Add to Function slice.
		pFn = &profile.Function{
			ID:         fnID,
			Name:       cf.FunctionName,
			SystemName: cf.FunctionName,
			Filename:   cf.URL,
		}
		pProf.Function = append(pProf.Function, pFn)

		fnID++

		// Add it to map
		fnMap[fnKey] = pFn
	}

	// Add to Location slice.
	loc := &profile.Location{
		ID: uint64(n.ID),
		Line: []profile.Line{
			Function: pFn,
			Line:     cf.LineNumber,
		},
	}
	pProf.Function = append(pProf.Function, loc)

	// Populating the loc field of the locMap
	locMap[n.ID] = locMeta{loc: loc}
}

// We need to iterate once more to build the parent-child chain.
for _, n := range prof.Nodes {
	parent := locMap[n.ID]
	// Visit each child node, get the node pointer from the map,
	// and set the parent pointer to the parent node.
	for _, childID := range n.Children {
		child := locMap[childID]
		child.parent = parent.loc
		locMap[childID] = child
	}
}

Once we have that, we can just iterate over samples array and consult our locMap to get the leaf node and from there walk up the chain to get the entire call stack.

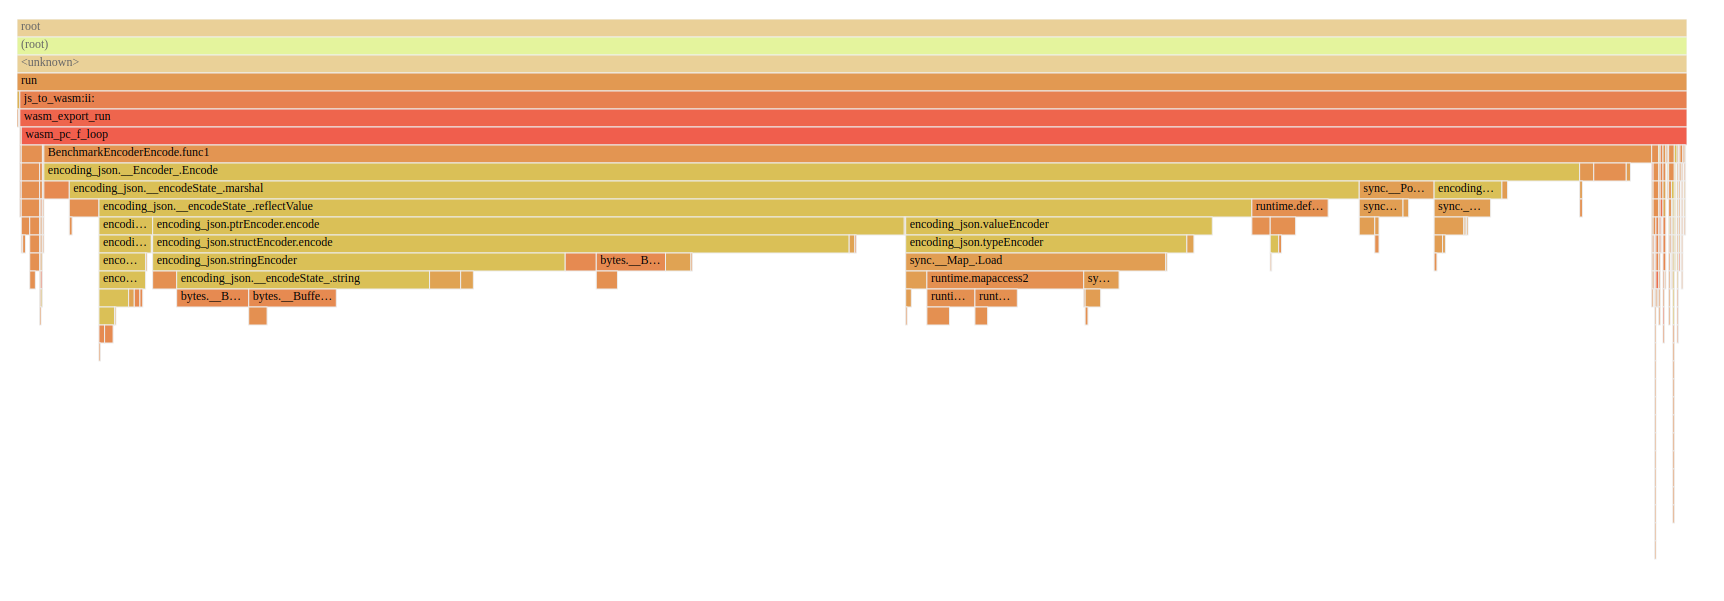
Finally, we now have our Samples, Location and Function slices along with other minor details which I have omitted. Using this, once we have the profile, we can simply run go tool pprof sample.prof and look at the call graph or the flame graph.

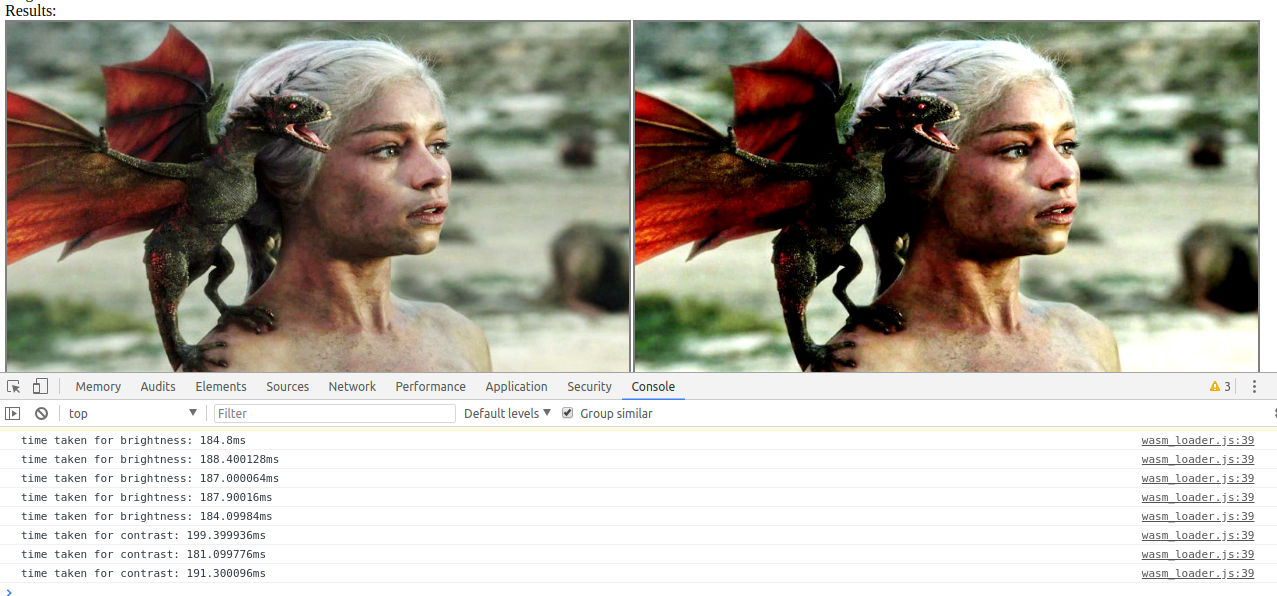
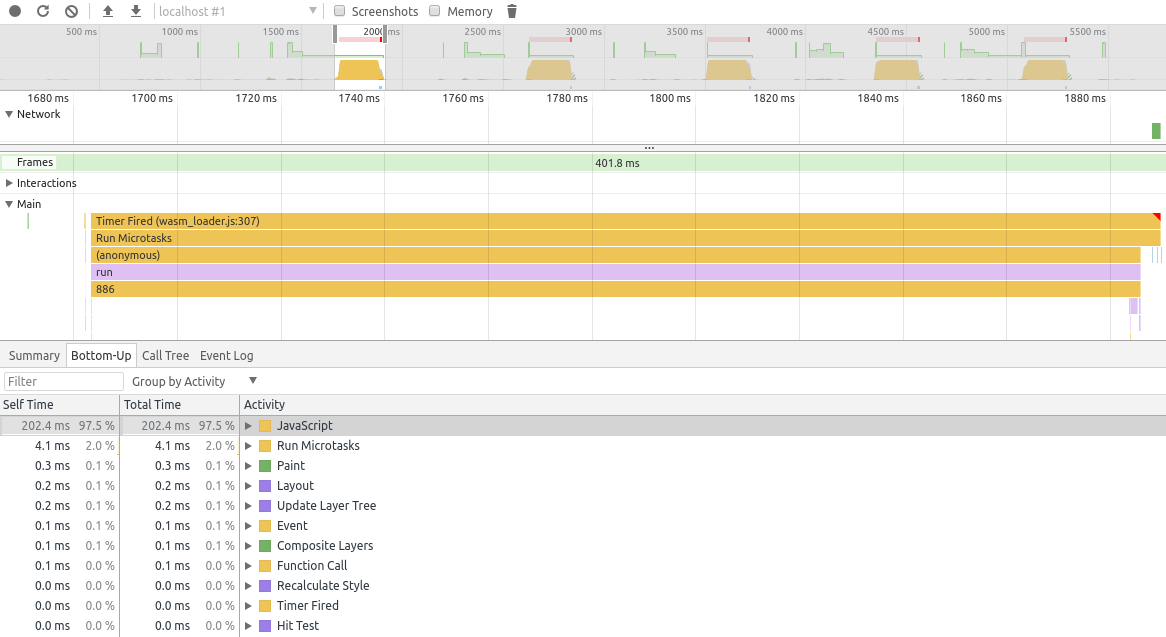
Here is an example of a profile taken for the encoding/json package’s EncoderEncode benchmark.

The SVG call graph

The Flame graph- flame graph

Please feel free to check the github repo to see the full source code.

Footnotes

  • The initial idea was to use a Selenium API and drive any browser to run the tests. But unfortunately, geckodriver does not support the ability to capture console logs - https://github.com/mozilla/geckodriver/issues/284. Hence, the shift to use the ChromeDP protocol circumvents the need to have any external driver binary and just have a browser installed in the machine.
  • Unfortunately, all of this will be moot once WebAssembly has thread support (which is already in an experimental phase). Nevertheless, I hope this post shed some light into how profiles are generated !
  • A big shoutout to Alexei Filippov from the Chrome Devtools team to help me understand some aspects of a CDP profile.

Taking the new Go error values proposal for a spin

UPDATE July 1, 2019: The proposal has changed since the blog post was written. Stack traces have been omitted. Now, only the Unwrap, Is and As functions are kept. Also the %w format verb can be used to wrap errors. More information here.

Original article follows:

There is a new error values proposal for the Go programming language which enhances the errors and fmt packages, adding ability to wrap errors and embed stack traces, amongst other changes. The changes are now available in the master branch and undergoing the feedback process.

I wanted to give it a spin and see how does it address some of the issues I’ve had while using errors. For posterity, I am using the master branch at go version devel +e96c4ace9c Mon Mar 18 10:50:57 2019 +0530 linux/amd64.

Stack Traces

Adding context to an error is good. But it does not add any value to the message when I need to find where the error is coming from and fix it. It does not matter if the message is error getting users: no rows found or no rows found, if I don’t know the line number of the error’s origin. And in a big codebase, it is an extremely uphill task to map the error message to the error origin. All I can do is grep for the error message and pray that the same message is not used multiple times.

Naturally, I was ecstatic to see that errors can capture stack traces now. Let’s look at an existing example which exemplifies the problem I mentioned above and then see how to add stack traces to the errors.

package main

import (
	// ...
)

func main() {
	// getting the db handle is omitted for brevity
	err := insert(db)
	if err != nil {
		log.Printf("%+v\n", err)
	}
}

func insert(db *sql.DB) error {
	tx, err := db.Begin()
	if err != nil {
		return err
	}
	var id int
	err = tx.QueryRow(`INSERT INTO tablename (name) VALUES ($1) RETURNING id`, "agniva").Scan(&id)
	if err != nil {
		tx.Rollback()
		return err
	}

	_, err = tx.Exec(`INSERT INTOtablename (name) VALUES ($1)`, "ayan") // This will fail. But how do we know just from the error ?
	if err != nil {
		tx.Rollback()
		return err
	}
	return tx.Commit()
}

The example is a bit contrived. But the idea here is that if any of the SQL queries fail, there is no way of knowing which one is it.

2019/03/20 12:18:40 pq: syntax error at or near "INTOtablename"

So we add some context to it -

err = tx.QueryRow(`INSERT INTO tablename (name) VALUES ($1) RETURNING id`, "agniva").Scan(&id)
if err != nil {
	tx.Rollback()
	return fmt.Errorf("insert and return: %v", err)
}

_, err = tx.Exec(`INSERT INTOtablename (name) VALUES ($1)`, "ayan")
if err != nil {
	tx.Rollback()
	return fmt.Errorf("only insert: %v", err)
}
2019/03/20 12:19:38 only insert: pq: syntax error at or near "INTOtablename"

But that’s still not enough. I will naturally forget in which file and in which function I wrote that query; leading me to grep for “only insert”. I just want that line number :tired_face:

But all that’s changing. With the new design, function, file and line information are added to all errors returned by errors.New and fmt.Errorf. And this stack information is displayed when the error is printed by “%+v”.

If the same code is executed using Go at tip:

2019/03/20 12:20:10 only insert:
    main.doDB
        /home/agniva/play/go/src/main.go:71
  - pq: syntax error at or near "INTOtablename"

But there are some catches here. Notice how we gave a : and then added a space before writing %v. That makes the returned error have the FormatError method which allows the error to be formatted cleanly. Also, the last argument must be an error for this to happen. If we remove the :, then we just get:

2019/03/20 23:28:38 only insert pq: syntax error at or near "INTOtablename":
    main.doDB
        /home/agniva/play/go/src/main.go:72

which is just the error message with the stack trace.

This feels very magical and surprising. And unsurprisingly, there has been considerable debate on this at https://github.com/golang/go/issues/29934. In the words of @rsc here -

It’s true that recognizing : %v is a bit magical. This is a good point to raise. If we were doing it from scratch, we would not do that. But an explicit goal here is to make as many existing programs automatically start working better, just like we did in the monotonic time changes. Sometimes that constrains us more than starting on a blank slate. On balance we believe that the automatic update is a big win and worth the magic.

But now that I have the line numbers, I don’t really need to add extra context. I can just write:

err = tx.QueryRow(`INSERT INTO tablename (name) VALUES ($1) RETURNING id`, "agniva").Scan(&id)
if err != nil {
	tx.Rollback()
	return fmt.Errorf(": %v", err)
}

_, err = tx.Exec(`INSERT INTOtablename (name) VALUES ($1)`, "ayan")
if err != nil {
	tx.Rollback()
	return fmt.Errorf(": %v", err)
}
2019/03/20 13:08:15 main.doDB
        /home/agniva/play/go/src/main.go:71
  - pq: syntax error at or near "INTOtablename"

Personally, I feel this is pretty clumsy, and having to write “: %v” every time is quite cumbersome. I still think that adding a new function is cleaner and much more readable. If you read errors.WithFrame(err) instead of fmt.Errorf(": %v", err), it is immediately clear what the code is trying to achieve.

With that said, the package does expose a Frame type which allows you to create your own errors with stack information. So it is quite easy to write a helper function which does the equivalent of fmt.Errorf(": %v", err).

A crude implementation can be something like:

func withFrame(err error) error {
	return errFrame{err, errors.Caller(1)}
}

type errFrame struct {
	err error
	f   errors.Frame
}

func (ef errFrame) Error() string {
	return ef.err.Error()
}

func (ef errFrame) FormatError(p errors.Printer) (next error) {
	ef.f.Format(p)
	return ef.err
}

And then just call withFrame instead of fmt.Errorf(": %v", err):

err = tx.QueryRow(`INSERT INTO tablename (name) VALUES ($1) RETURNING id`, "agniva").Scan(&id)
if err != nil {
	tx.Rollback()
	return withFrame(err)
}

_, err = tx.Exec(`INSERT INTOtablename (name) VALUES ($1)`, "ayan")
if err != nil {
	tx.Rollback()
	return withFrame(err)
}

This generates the same output as before.

Wrapping Errors

Alright, it’s great that we are finally able to capture stack traces. But there is more to the proposal than just that. We also have the ability now to embed an error inside another error without losing any of the type information of the original error.

For example, in our previous example, we used fmt.Errorf(": %v", err) to capture the line number. But now we have lost the information that err was of type pq.Error or it could even have been sql.ErrNoRows which the caller function could have checked and taken appropriate actions. To be able to wrap the error, we need to use a new formatting verb w. Here is what it looks like:

err = tx.QueryRow(`INSERT INTO tablename (name) VALUES ($1) RETURNING id`, "agniva").Scan(&id)
if err != nil {
	tx.Rollback()
	return fmt.Errorf(": %w", err)
}

_, err = tx.Exec(`INSERT INTOtablename (name) VALUES ($1)`, "ayan")
if err != nil {
	tx.Rollback()
	return fmt.Errorf(": %w", err)
}

Now, the position information is captured as well as the original error is wrapped into the new error. This allows us to inspect the returned error and perform checks on it. The proposal gives us 2 functions to help with that- errors.Is and errors.As.

func As(err error, target interface{}) bool

As finds the first error in err’s chain that matches the type to which target points, and if so, sets the target to its value and returns true. An error matches a type if it is assignable to the target type, or if it has a method As(interface{}) bool such that As(target) returns true.

So in our case, to check whether err is of type pq.Error:

func main() {
	// getting the db handle is omitted for brevity
	err := insert(db)
	if err != nil {
		log.Printf("%+v\n", err)
	}
	pqe := &pq.Error{}
	if errors.As(err, &pqe) {
		log.Println("Yep, a pq.Error")
	}
}
2019/03/20 14:28:33 main.doDB
        /home/agniva/play/go/src/main.go:72
  - pq: syntax error at or near "INTOtablename"
2019/03/20 14:28:33 Yep, a pq.Error

func Is(err, target error) bool

Is reports whether any error in err’s chain matches target. An error is considered to match a target if it is equal to that target or if it implements a method Is(error) bool such that Is(target) returns true.

Continuing with our previous example:

func main() {
	// getting the db handle is omitted for brevity
	err := insert(db)
	if err != nil {
		log.Printf("%+v\n", err)
	}
	pqe := &pq.Error{}
	if errors.As(err, &pqe) {
		log.Println("Yep, a pq.Error")
	}
	if errors.Is(err, sql.ErrNoRows) {
		log.Println("Yep, a sql.ErrNoRows")
	}
}
2019/03/20 14:29:03 main.doDB
        /home/agniva/play/go/src/main.go:72
  - pq: syntax error at or near "INTOtablename"
2019/03/20 14:29:03 Yep, a pq.Error

ErrNoRows did not match, which is what we expect.

Custom error types can also be wrapped and checked in a similar manner. But to be able to unwrap the error, the type needs to satisfy the Wrapper interface, and have a Unwrap method which returns the inner error. Let’s say we want to return ErrNoUser if a sql.ErrNoRows is returned. We can do:

type ErrNoUser struct {
	err error
}

func (e ErrNoUser) Error() string {
	return e.err.Error()
}

// Unwrap satisfies the Wrapper interface.
func (e ErrNoUser) Unwrap() error {
	return e.err
}

func main() {
	// getting the db handle is omitted for brevity
	err := getUser(db)
	if err != nil {
		log.Printf("%+v\n", err)
	}
	ff := ErrNoUser{}
	if errors.As(err, &ff) {
		log.Println("Yep, ErrNoUser")
	}
}

func getUser(db *sql.DB) error {
	var id int
	err := db.QueryRow(`SELECT id from tablename WHERE name=$1`, "notexist").Scan(&id)
	if err == sql.ErrNoRows {
		return fmt.Errorf(": %w", ErrNoUser{err: err})
	}
	return err
}
2019/03/21 10:56:16 main.getUser
        /home/agniva/play/go/src/main.go:100
  - sql: no rows in result set
2019/03/21 10:56:16 Yep, ErrNoUser

This is mostly my take on how to integrate the new changes into a codebase. But it is in no way an exhaustive tutorial on it. For a deeper look, please feel free to read the proposal. There is also an FAQ which touches on some useful topics.

TLDR

There is a new proposal which makes some changes to the errors and fmt packages. The highlights of which are:

  • All errors returned by errors.New and fmt.Errorf now capture stack information.
  • The stack can be printed by using %+v which is the “detail mode”.
  • For fmt.Errorf, if the last argument is an error and the format string ends with : %s, : %v or : %w, the returned error will have the FormatError method. In case of %w, the error will also be wrapped and have the Unwrap method.
  • There are 2 new convenience functions errors.Is and errors.As which allow for error inspection.

As always, please feel free to point out any errors or suggestions in the comments. Thanks for reading !

How to write a Vet analyzer pass

The Go toolchain has the vet command which can be used to to perform static checks on a codebase. But a significant problem of vet was that it was not extensible. vet was structured as a monolithic executable with a fixed suite of checkers. To overcome this, the ecosystem started developing its own tools like staticcheck and go-critic. The problem with this is that every tool has its own way to load and parse the source code. Hence, a checker written for one tool would require extensive effort to be able to run on a different driver.

During the 1.12 release cycle, a new API for static code analysis was developed: the golang.org/x/tools/go/analysis package. This creates a standard API for writing Go static analyzers, which allows them to be easily shared with the rest of the ecosystem in a plug-and-play model.

In this post, we will see how to go about writing an analyzer using this new API.

Background

SQL queries are always evaluated at runtime. As a result, if you make a syntax error in a SQL query, there is no way to catch that until you run the code or write a test for it. There was this peculiar pattern in particular, that was always tripping me up.

Let’s say I have a SQL query like:

db.Exec("insert into table (c1, c2, c3, c4) values ($1, $2, $3, $4)", p1, p2, p3, p4)

It’s the middle of the night and I need to add a new column. I quickly change the query to:

db.Exec("insert into table (c1, c2, c3, c4, c5) values ($1, $2, $3, $4)", p1, p2, p3, p4, p5).

It seems like things are fine, but I have just missed a $5. This bugged me so much that I wanted to write a vet analyzer for this to detect patterns like these and flag them.

There are other semantic checks we can apply like matching the number of positional args with the number of params passed and so on. But in this post, we will just focus on the most basic check of verifying whether a sql query is syntactically correct or not.

Layout of an analyzer

All analyzers usually expose a global variable Analyzer of type analysis.Analyzer. It is this variable which is imported by driver packages.

Let us see what it looks like:

var Analyzer = &analysis.Analyzer{
	Name:             "sqlargs",                                 // name of the analyzer
	Doc:              "check sql query strings for correctness", // documentation
	Run:              run,                                       // perform your analysis here
	Requires:         []*analysis.Analyzer{inspect.Analyzer},    // a set of analyzers which must run before the current one.
	RunDespiteErrors: true,
}

Most of the fields are self-explanatory. The actual analysis is performed by run: a function which takes an analysis.Pass as an argument. The pass variable provides information to the run function to perform its tasks and optionally pass on information to other analyzers.

It looks like:

func run(pass *analysis.Pass) (interface{}, error) {
}

Now, to run this analyzer, we will use the singlechecker package which can be used to run a single analyzer.

package main

import (
	"github.com/agnivade/sqlargs"
	"golang.org/x/tools/go/analysis/singlechecker"
)

func main() { singlechecker.Main(sqlargs.Analyzer) }

Upon successfully compiling this, you can execute the binary as a standalone tool on your codebase: sqlargs ./....

This is the standard layout of all analyzers. Let us have a look into the internals of the run function, which is where the main code analysis is performed.

Look for SQL queries

Our primary aim is to look for expressions like db.Exec("<query>") in the code base and analyze them. This requires knowledge of Go ASTs (Abstract Syntax Tree) to slice and dice the source code and extract the stuff that we need.

To help us with scavenging the codebase and filtering the AST expressions that we need, we have some tools at our disposal, viz. the go/ast/inspector package. Using this, we just specify the node type in the source code that we are interested in and it does the rest. Since this is a very common task for all analyzers, we have an inspect pass which returns an inspector for a given pass.

Let us see how that looks like:

import (
	"golang.org/x/tools/go/analysis"
	"golang.org/x/tools/go/analysis/passes/inspect"
	"golang.org/x/tools/go/ast/inspector"
)

func run(pass *analysis.Pass) (interface{}, error) {
	inspect := pass.ResultOf[inspect.Analyzer].(*inspector.Inspector)
	// We filter only function calls.
	nodeFilter := []ast.Node{
		(*ast.CallExpr)(nil),
	}

	inspect.Preorder(nodeFilter, func(n ast.Node) {
		call := n.(*ast.CallExpr)
		_ = call // work with the call expression that we have
	})
}

All expressions of the form of db.Exec("<query>") are called CallExprs. So we specify that in our nodeFilter. After that, the Preorder function will give us only CallExprs found in the codebase.

A CallExpr has two parts- Fun and Args. A Fun can either be an Ident (for example Fun()) or a SelectorExpr (for example foo.Fun()). Since we are looking for patterns like db.Exec, we need to filter only SelectorExprs.

inspect.Preorder(nodeFilter, func(n ast.Node) {
	call := n.(*ast.CallExpr)
	sel, ok := call.Fun.(*ast.SelectorExpr)
	if !ok {
		return
	}

})

Alright, so far so good. This means we have filtered all expressions of the form of type.Method() from the source code. Now we need to verify 2 things:

  1. The function name is Exec; because that is what we are interested in.
  2. The type of the selector is sql.DB. (To keep things simple, we will ignore the case when sql.DB is embedded in another struct).

Let us peek into the SelectorExpr to get these. A SelectorExpr again has two parts- X and Sel. If we take an example of db.Exec()- then db is X, and Exec is Sel. Matching the function name is easy. But to get the type info, we need to take help of analysis.Pass passed in the run function.

Pass contains a TypesInfo field which contain type information about the package. We need to use that to get the type of X and verify that the object comes from the database/sql package and is of type *sql.DB.

inspect.Preorder(nodeFilter, func(n ast.Node) {
	call := n.(*ast.CallExpr)
	sel, ok := call.Fun.(*ast.SelectorExpr)
	if !ok {
		return
	}

	// Get the type of X
	typ, ok := pass.TypesInfo.Types[sel.X]
	if !ok {
		return
	}

	t := typ.Type
	// If it is a pointer, get the element.
	if ptr, ok := t.(*types.Pointer); ok {
		t = ptr.Elem()
	}
	nTyp, ok := t.(*types.Named)
	if !ok {
		return
	}
})

Now, from nTyp we can get the type info of X and directly match the function name from Sel.

// Get the function name
sel.Sel.Name // == "Exec"

// Get the object name
nTyp.Obj().Name() // == "DB"

// Check the import of the object
nTyp.Obj().Pkg().Path() // == "database/sql"

Extract the query string

Alright ! We have successfully filtered out only expressions of type (*sql.DB).Exec. The only thing remaining is to extract the query string from the CallExpr and check it for syntax errors.

So far, we have been dealing with the Fun field of a CallExpr. To get the query string, we need to access Args. A db.Exec call will have the query string as its first param and the arguments follow after. We will get the first element of the Args slice and then use TypesInfo.Types again to get the value of the argument.

// Code continues from before.

arg0 := call.Args[0]
typ, ok := pass.TypesInfo.Types[arg0]
if !ok || typ.Value == nil {
	return
}

_ = constant.StringVal(typ.Value) // Gives us the query string ! (constant is from "go/constant")

Note that this doesn’t work if the query string is a variable. A lot of codebases have a query template string and generate the final query string dynamically. So, for example, the following will not be caught by our analyzer:

q := `SELECT %s FROM certificates WHERE date=$1;`
query := fmt.Sprintf(q, table)
db.Exec(query, date)

All that is left is for us to check the query string for syntax errors. We will use the github.com/lfittl/pg_query_go package for that. And if we get an error, pass has a Reportf helper method to print out diagnostics found during a vet pass. So:

query := constant.StringVal(typ.Value)
_, err := pg_query.Parse(query)
if err != nil {
	pass.Reportf(call.Lparen, "Invalid query: %v", err)
	return
}

The final result looks like this:

func run(pass *analysis.Pass) (interface{}, error) {
	inspect := pass.ResultOf[inspect.Analyzer].(*inspector.Inspector)
	// We filter only function calls.
	nodeFilter := []ast.Node{
		(*ast.CallExpr)(nil),
	}

	inspect.Preorder(nodeFilter, func(n ast.Node) {
		call := n.(*ast.CallExpr)
		sel, ok := call.Fun.(*ast.SelectorExpr)
		if !ok {
			return
		}

		// Get the type of X
		typ, ok := pass.TypesInfo.Types[sel.X]
		if !ok {
			return
		}

		t := typ.Type
		// If it is a pointer, get the element.
		if ptr, ok := t.(*types.Pointer); ok {
			t = ptr.Elem()
		}
		nTyp, ok := t.(*types.Named)
		if !ok {
			return
		}

		if sel.Sel.Name != "Exec" &&
			nTyp.Obj().Name() != "DB" &&
			nTyp.Obj().Pkg().Path() != "database/sql" {
			return
		}

		arg0 := call.Args[0]
		typ, ok = pass.TypesInfo.Types[arg0]
		if !ok || typ.Value == nil {
			return
		}

		query := constant.StringVal(typ.Value)
		_, err := pg_query.Parse(query)
		if err != nil {
			pass.Reportf(call.Lparen, "Invalid query: %v", err)
			return
		}
	})
}

Tests

The golang.org/x/tools/go/analysis/analysistest package provides several helpers to make testing of vet passes a breeze. We just need to have our sample code that we want to test in a package. That package should reside inside the testdata folder which acts as the GOPATH for the test.

Let’s say we have a file basic.go which contains db.Exec function calls that we want to test. So the folder structure needed is:

testdata
    └── src
        └── basic
            └── basic.go

To verify expected diagnostics, we just need to add comments of the form // want ".." beside the line which is expected to throw the error. So for example, this is what the file basic.go might look like-

func runDB() {
	var db *sql.DB
	defer db.Close()

	db.Exec(`INSERT INTO t (c1, c2) VALUES ($1, $2)`, p1, "const") // no error
	db.Exec(`INSERT INTO t(c1 c2) VALUES ($1, $2)`, p1, p2) // want `Invalid query: syntax error at or near "c2"`
}

And finally to run the test, we import the analysistest package and pass our analyzer, pointing to the package that we want to test.

import (
	"testing"

	"github.com/agnivade/sqlargs"
	"golang.org/x/tools/go/analysis/analysistest"
)

func TestBasic(t *testing.T) {
	testdata := analysistest.TestData()
	analysistest.Run(t, testdata, sqlargs.Analyzer, "basic") // loads testdata/src/basic
}

That’s it !

To quickly recap-

  1. We saw the basic layout of all analyzers.
  2. We used the inspect pass to filter the AST nodes that we want.
  3. Once we got our node, we used the pass.TypesInfo.Type map to give us type information about an object.
  4. We used that to verify that the received object comes from the database/sql package and is of type *sql.DB.
  5. Then we extracted the first argument from the CallExpr and checked whether the string is a valid SQL query or not.

This was a short demo of how to go about writing a vet analyzer. Note that sql strings can also appear in other libraries like sqlx or gorm. Matching objects only with type of *sql.DB is not enough. One needs to maintain a list of type and method names to be matched. But I have kept things simple for the sake of the article. The full source code is available here. Please feel free to download and run sqlargs on your codebase. If you find a mistake in the article, please do point it out in the comments !

Experiments with image manipulation in WASM using Go

The Go master branch recently finished a working prototype implementation of WebAssembly. And being a WASM enthusiast, I naturally wanted to take it out for a spin.

In this post, I will be writing down my thoughts on a weekend experiment I did with manipulating images in Go. The demo just takes an input image from the browser, and applies various image transformations like brightness, contrast, hue, saturation etc. and then dumps it back to the browser. This tests 2 things - plain CPU bound execution which is what the image transformation should be doing, and moving data to and fro between JS and Go land.

Callbacks

It should be clarified how to communicate with Go from JS land. It is not the usual way we do in emscripten; which is to expose a function and call that function from JS. In Go, interop with JS is done through callbacks. In your Go code, you set up callbacks which can be invoked from JS. These are mainly event handlers to which you want your Go code to be executed against.

It looks something like this -

js.NewEventCallback(js.PreventDefault, func(ev js.Value) {
	// handle event
})

There is a pattern here - as your application grows, it becomes a list callback handlers to DOM events. I look at it like url handlers of a REST app.

To arrange it, I declare all of my callbacks as methods of my main struct and attach them in a single place. Kind of similar to how you will declare the url handlers in different files and setup all of your routes in a single place.

// Setup callbacks
s.setupOnImgLoadCb()
js.Global.Get("document").
	Call("getElementById", "sourceImg").
	Call("addEventListener", "load", s.onImgLoadCb)

s.setupBrightnessCb()
js.Global.Get("document").
	Call("getElementById", "brightness").
	Call("addEventListener", "change", s.brightnessCb)

s.setupContrastCb()
js.Global.Get("document").
	Call("getElementById", "contrast").
	Call("addEventListener", "change", s.contrastCb)

And then in a separate file, write your callback code -

func (s *Shimmer) setupHueCb() {
	s.hueCb = js.NewEventCallback(js.PreventDefault, func(ev js.Value) {
		// quick return if no source image is yet uploaded
		if s.sourceImg == nil {
			return
		}
		delta := ev.Get("target").Get("value").Int()
		start := time.Now()
		res := adjust.Hue(s.sourceImg, delta)
		s.updateImage(res, start)
	})
}

Implementation

My primary gripe is the way image data is being passed around from Go land to the browser land.

While uploading the image, I am setting the src attribute to the base64 encoded format of the entire image. That value goes to Go code, which then decodes it back to binary, applies the transformation and then encodes it back to base64 and sets the src attribute of the target image.

This makes the DOM incredibly heavy and requires passing a huge string from Go to JS. Possibly, if SharedArrayBuffer support lands in WASM, this might improve. I am also looking into setting pixels directly in a canvas and see if that gives any benefit. Even shaving off this base64 conversion should buy us some time. (Other ideas will be very appreciated :grin:)

Performance

For a JPEG image of size 100KB, the time it takes for it to apply the transformation is around 180-190ms. The time increases with the size of the image. This is using Chrome 65. (FF has been giving me some errors which I didnt have time to investigate into :sweat_smile:).

timings

Performance snapshots show something similar.

perf

The heap can be quite huge. A heap snapshot resulted in about 1GB size.

Finishing thoughts

The complete repo is here - github.com/agnivade/shimmer. Feel free to poke around it. Just a reminder that I wrote it in one day, so obviously there are things that can be improved. I will be looking into those next.

P.S. - Slight note that image transformations are not applied on top of another. i.e. if you change the brightness and then change hue, the resulting image will just change hue from the original base image. This is a TODO item for now.

Learn Web Assembly the hard way

I had experimented with web assembly before, but only upto running the “hello world” example. After reading a recent post on how to load wasm modules efficiently, I decided to jump into the gory details of web assembly and learn it the hard way.

What follows is a recount of that adventure.

For our demo, we will have the simplest possible function which will just return the number 42. And then go from easiest to the hardest level to run it. As a pre-requisite, you need to have the emscripten toolchain up and running. Please refer to - http://kripken.github.io/emscripten-site/docs/getting_started/downloads.html for instructions.

Level 0 :sunglasses:

Create a file hello.c:

#include <emscripten.h>

EMSCRIPTEN_KEEPALIVE
int fib() {
  return 42;
}

Compile it with emcc hello.c -s WASM=1 -o hello.js

The flag WASM=1 is used to signal emscripten to generate wasm code. Otherwise, it generates asm.js code by default. Note that even if the output is set to hello.js, it will generate hello.wasm and hello.js. The .js file loads the .wasm file and sets up important environment stuff.

Then load this in an HTML file like:

<html>
<head>
<script src="hello.js"></script>
<script>
Module.onRuntimeInitialized = function() {
  console.log(Module._fib())
}
</script>
</head>
</html>

Put all of these files in a folder and run a local web server.

Great, this completes level 0. But the js file is just a shim which sets up some stuff which we don’t want. We want to load the .wasm file by ourselves and run that. Let’s do that.

Level 1 :godmode:

Let’s try with the one mentioned here - https://developers.google.com/web/updates/2018/03/emscripting-a-c-library. Modify the HTML file to -

<html>
<head>
<script>
(async function() {
  const imports = {
    env: {
      memory: new WebAssembly.Memory({initial: 1}),
      STACKTOP: 0,
    }
  };
  const {instance} = await WebAssembly.instantiateStreaming(fetch('hello.wasm'), imports);
  console.log(instance.exports._fib());
})();
</script>
</head>
</html>

We have a wonderfully cryptic error: WebAssembly Instantiation: Import #5 module="global" error: module is not an object or function

Some digging around in SO (here and here) led me to find that normally compiling with the -s WASM=1 flag will add some other glue code along with the wasm code to interact with the javascript runtime. However, in our case it is not needed at all. We can remove it with -s SIDE_MODULE=1

Alright, so let’s try - emcc hello.c -s WASM=1 -s SIDE_MODULE=1 -o hello.jsand modify the code to as mentioned in the links.

(async () => {
  const config = {
    env: {
        memoryBase: 0,
        tableBase: 0,
        memory: new WebAssembly.Memory({
            initial: 256,
        }),
        table: new WebAssembly.Table({
            initial: 0,
            element: 'anyfunc',
        }),
    }
  }
  const fetchPromise = fetch('hello.wasm');
  const {instance} = await WebAssembly.instantiateStreaming(fetchPromise, config);
  const result = instance.exports._fib();
  console.log(result);
})();

Still no luck. Same error.

Finally, after a couple of frustrating hours, a break came through this post - https://stackoverflow.com/questions/44346670/webassembly-link-error-import-object-field-dynamictop-ptr-is-not-a-number.

So it seems that an optimization flag greater than 0 is required. Otherwise even if you mention SIDE_MODULE, it does not remove the runtime.

Let’s add that flag and run the command - emcc hello.c -Os -s WASM=1 -s SIDE_MODULE=1 -o hello.wasm

Note that in this case, we directly generate the .wasm file without any js shim.

This works !

Level 2 :goberserk:

But we need to go deeper. Is there no way to compile to normal web assembly and still load the wasm file without the js shim ? Of course there was.

Digging a bit further, I got some more clarity from this page - https://github.com/kripken/emscripten/wiki/WebAssembly-Standalone. So either we use -s SIDE_MODULE=1 to create a dynamic library, or we can pass -Os to remove the runtime. But in the latter case, we need to write our own loading code to use it. Strap on, this adventure is going to get bumpy.

Let’s use the same code and compile without the -s SIDE_MODULE=1 flag and see what error we get.

Import #0 module="env" function="DYNAMICTOP_PTR" error: global import must be a number.

By just making a guess, I understood that the env object must need a DYNAMICTOP_PTR field as a number. Let’s add DYNAMICTOP_PTR as 0 in the env object and see what happens.

We have a new error - WebAssembly Instantiation: Import #1 module="env" function="STACKTOP" error: global import must be a number.

Ok, it looks like there are still more imports that need to be added. This was getting to be a whack-a-mole game. I remembered that there is a WebAssembly Binary Toolkit which comprises of a suite of tools used to translate between wasm and wat format.

Let’s try to convert our wasm file to wat and take a peek inside.

$wasm2wat hello.wasm  | head -30
(module
  (type (;0;) (func (param i32 i32 i32) (result i32)))
  (type (;1;) (func (param i32) (result i32)))
  (type (;2;) (func (param i32)))
  (type (;3;) (func (result i32)))
  (type (;4;) (func (param i32 i32) (result i32)))
  (type (;5;) (func (param i32 i32)))
  (type (;6;) (func))
  (type (;7;) (func (param i32 i32 i32 i32) (result i32)))
  (import "env" "DYNAMICTOP_PTR" (global (;0;) i32))
  (import "env" "STACKTOP" (global (;1;) i32))
  (import "env" "STACK_MAX" (global (;2;) i32))
  (import "env" "abort" (func (;0;) (type 2)))
  (import "env" "enlargeMemory" (func (;1;) (type 3)))
  (import "env" "getTotalMemory" (func (;2;) (type 3)))
  (import "env" "abortOnCannotGrowMemory" (func (;3;) (type 3)))
  (import "env" "___lock" (func (;4;) (type 2)))
  (import "env" "___syscall6" (func (;5;) (type 4)))
  (import "env" "___setErrNo" (func (;6;) (type 2)))
  (import "env" "___syscall140" (func (;7;) (type 4)))
  (import "env" "_emscripten_memcpy_big" (func (;8;) (type 0)))
  (import "env" "___syscall54" (func (;9;) (type 4)))
  (import "env" "___unlock" (func (;10;) (type 2)))
  (import "env" "___syscall146" (func (;11;) (type 4)))
  (import "env" "memory" (memory (;0;) 256 256))
  (import "env" "table" (table (;0;) 6 6 anyfunc))
  (import "env" "memoryBase" (global (;3;) i32))
  (import "env" "tableBase" (global (;4;) i32))
  (func (;12;) (type 1) (param i32) (result i32)
    (local i32)

Ah, so now we have a better picture. We can see that apart from memory, table, memoryBase and tableBase which we had added earlier, we have to include a whole lot of functions for this to work. Let’s do that.

(async () => {
  const config = {
    env: {
        DYNAMICTOP_PTR: 0,
        STACKTOP: 0,
        STACK_MAX: 0,
        abort: function() {},
        enlargeMemory: function() {},
        getTotalMemory: function() {},
        abortOnCannotGrowMemory: function() {},
        ___lock: function() {},
        ___syscall6: function() {},
        ___setErrNo: function() {},
        ___syscall140: function() {},
        _emscripten_memcpy_big: function() {},
        ___syscall54: function() {},
        ___unlock: function() {},
        ___syscall146: function() {},

        memory: new WebAssembly.Memory({initial: 256, maximum: 256}),
        table: new WebAssembly.Table({initial: 6, element: 'anyfunc', maximum: 6}),
        memoryBase: 0,
        tableBase: 0,
    }
  }
  const fetchPromise = fetch('hello.wasm');
  const {instance} = await WebAssembly.instantiateStreaming(fetchPromise, config);
  const result = instance.exports._fib();
  console.log(result);
})();

And voila ! This code works.

Level 3 :trollface:

Now that I have come so far, I wanted to write the code in the wat (web assembly text) format itself to get the full experience. Turns out, the wat format is quite readable and easy to understand.

Decompiling the current hello.wasm with the same wasm2wat command as before, and scrolling to our fib function shows this -

(func (;19;) (type 3) (result i32)
  i32.const 42)

Not completely readable, but not very cryptic too. Web Assembly uses a stack architecture where values are put on the stack. When a function finishes execution, there is just a single value left on the stack, which becomes the return value of the function.

So this code seems like it is putting a constant 42 on the stack, which is finally returned.

Let’s write a .wat file like -

(module
   (func $fib (result i32)
      i32.const 42
   )
   (export "fib" (func $fib))
)

And then compile it to .wasm with wat2wasm hello.wat

Now, our wasm file does not have any dependencies. So we can get rid of our import object altogether !

(async () => {
  const fetchPromise = fetch('hello.wasm');
  const {instance} = await WebAssembly.instantiateStreaming(fetchPromise);
  const result = instance.exports.fib();
  console.log(result);
})();

Finally, we have the code which we want :relieved:. Since we are hand writing our wasm code, we have full control of everything, and therefore we don’t need to go through extra hoops of js glue. This is certainly not something which you would want to do for production applications, but it is an interesting adventure to open the hood of web assembly and take a peek inside.